This page contains a collection of images which we have created to make aesthetic representations of our research, hopefully making it more appealing to non-experts. The images are shown together with the original publications they refer to, as well as a short description of the rationale behind the visualisations. Most images have been rendered using Povray, and without help from artificial intelligence. See here for how chatGPT imagines our research.
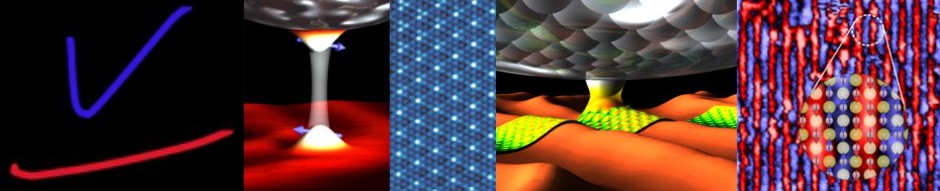
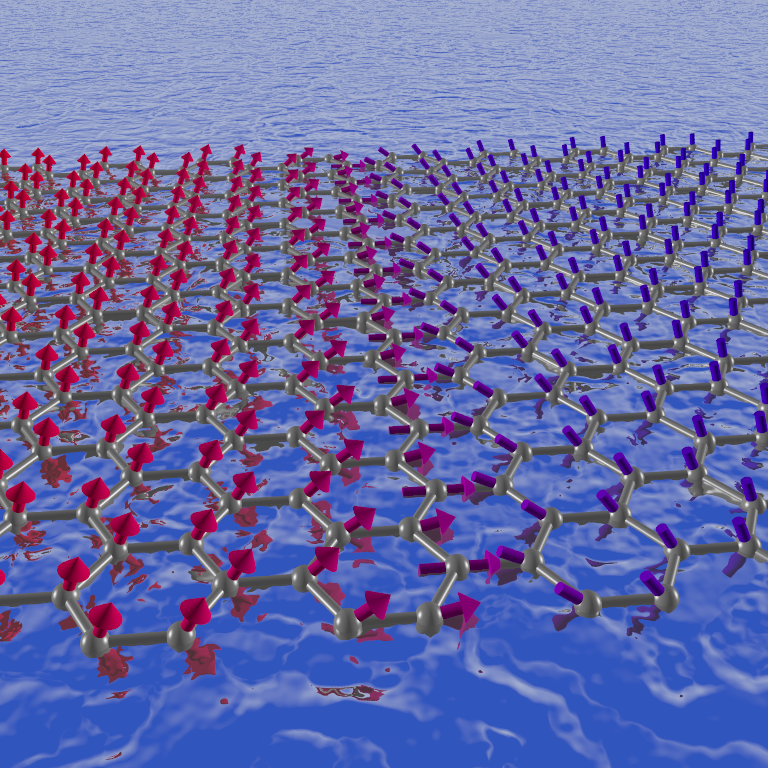
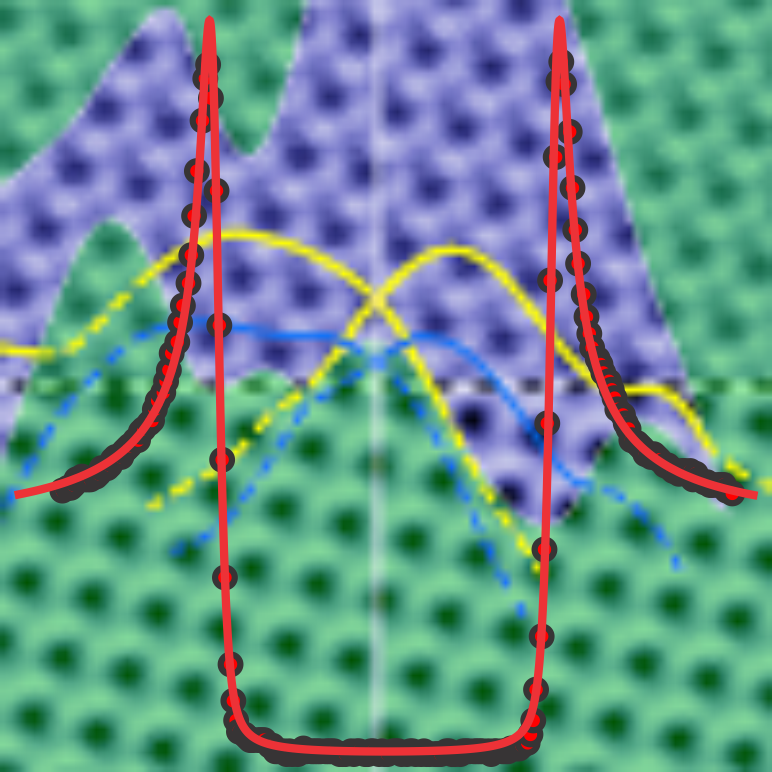
| Giant magnetostriction in a correlated ferromagnet: Using scanning tunneling microscopy at ultra-low temperatures, we find how the electronic states and crystal structure change between ferromagnetic and antiferromagnetic alignment of the surface layer and bulk magnetizations. The image shows the change in structure and, in the background, in tunneling spectra as the magnetic configuration is changed from left to right between antiferromagnetic, to ferromagnetic and back to antiferromagnetic configuration. Original publication: Carolina A. Marques, et al., Emergent exchange-driven giant magnetoelastic coupling in a correlated itinerant ferromagnet, Nat. Phys. 21, 1243 (2025). |
 |
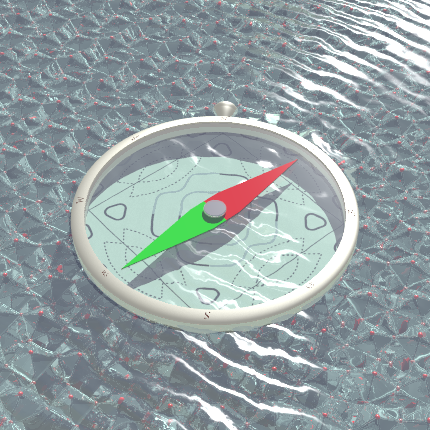
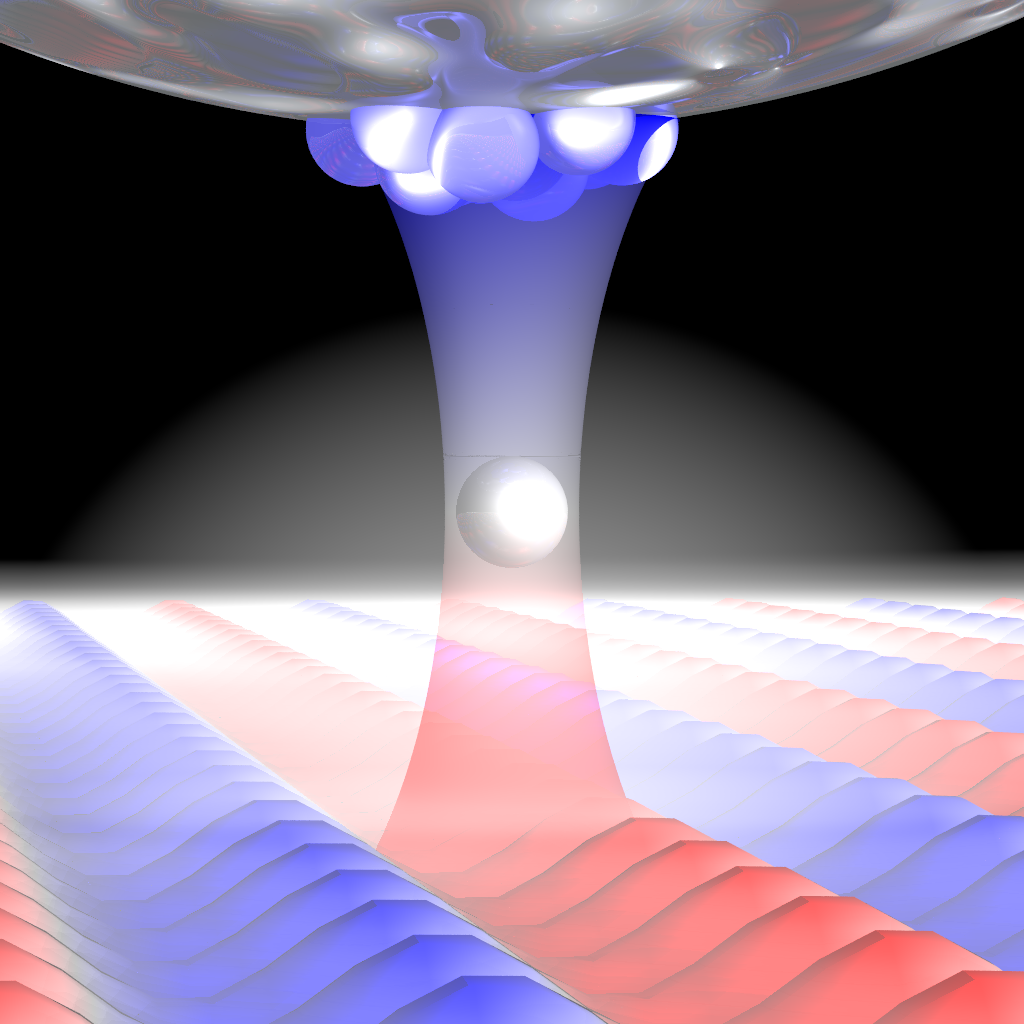
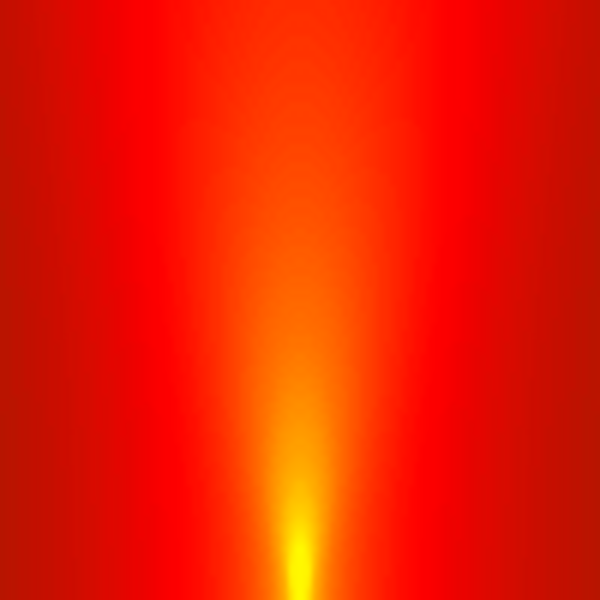
| Compass-like control of nematicity in Sr3Ru2O7 The image shows schematically what we observe experimentally: the electronic structure of the surface layer of Sr3Ru2O7 follows an applied magnetic field in a compass-like fashion. The ripples on the water surface (representing a Fermi liquid) show nematic behaviour (i.e. the waves are in the direction in which the compass needle points). The structure below the water surface is that of Sr3Ru2O7. On the crystal structure, the direction of the magnetization is indicated by spins which however is hardly visible because they are under water. The experimental findings can be fully explained by a model that accounts for ferromagnetism and spin-orbital coupling. Original publication: Masahiro Naritsuka, et al., Compass-like manipulation of electronic nematicity in Sr3Ru2O7, Proc. Nat. Acad. Sci. 120, e2308972120 (2023). |
 |
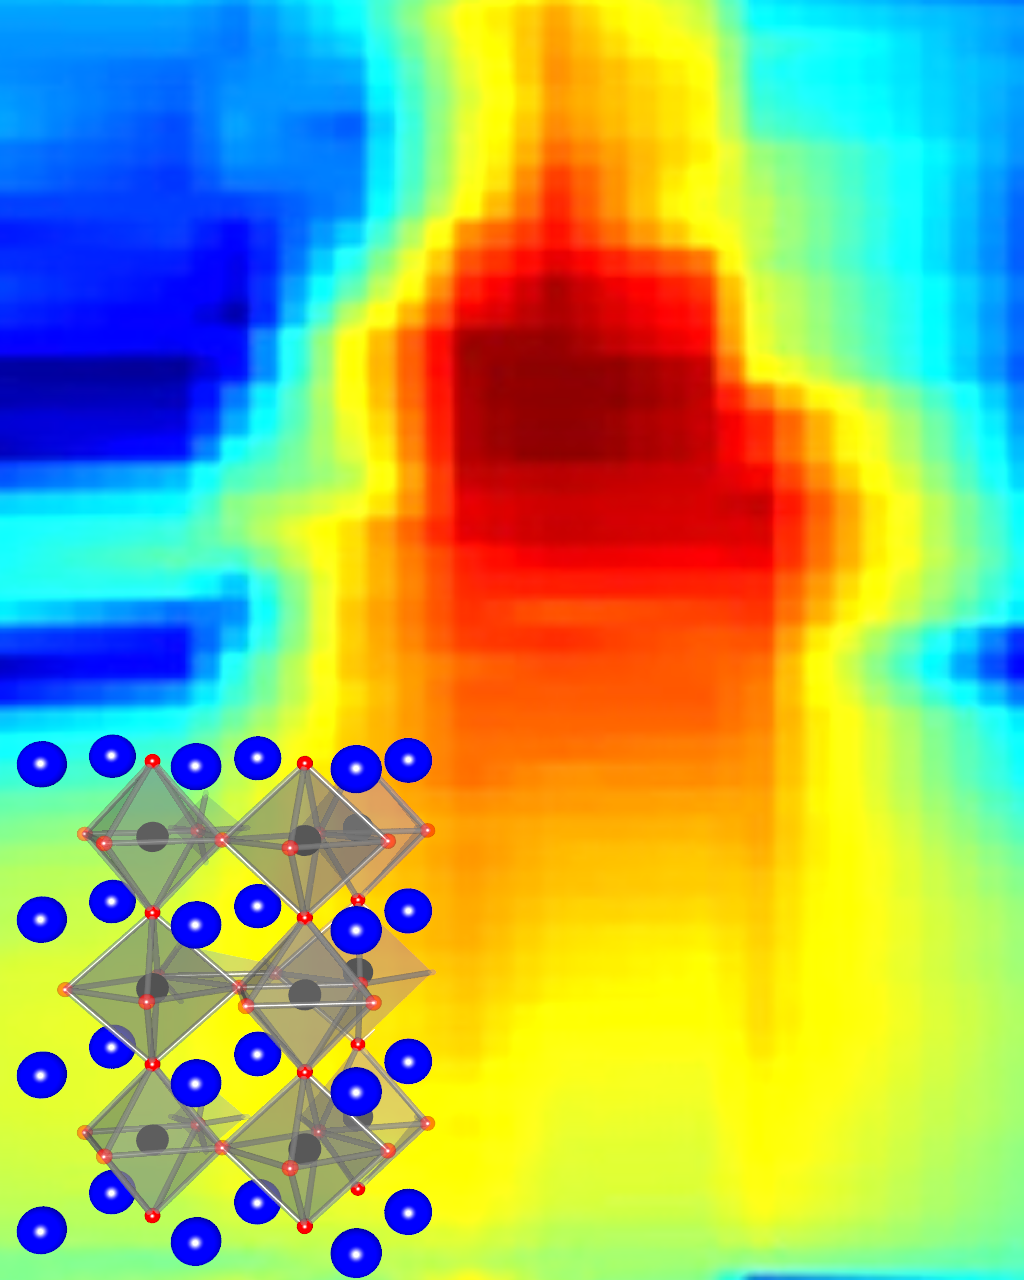
| Metamagnetism in Sr4Ru3O10 The background of the image shows the STM-based magnetostriction measurements, where the x axis represents the in-plane field angle, the y-axis the field (with zero field at the top) and the colour encodes the magnetostriction. The image highlights the symmetry breaking – it covers an angular range of 180°, but clearly does not exhibit a four-fold symmetry. In front of the measurement, the crystal structure of a single trilayer of Sr4Ru3O10 is shown. Original publication: Izidor Benedičič, et al., Interplay of ferromagnetism and spin-orbit coupling in Sr4Ru3O10, Phys. Rev. B 106, L241107 (2022). |
 |
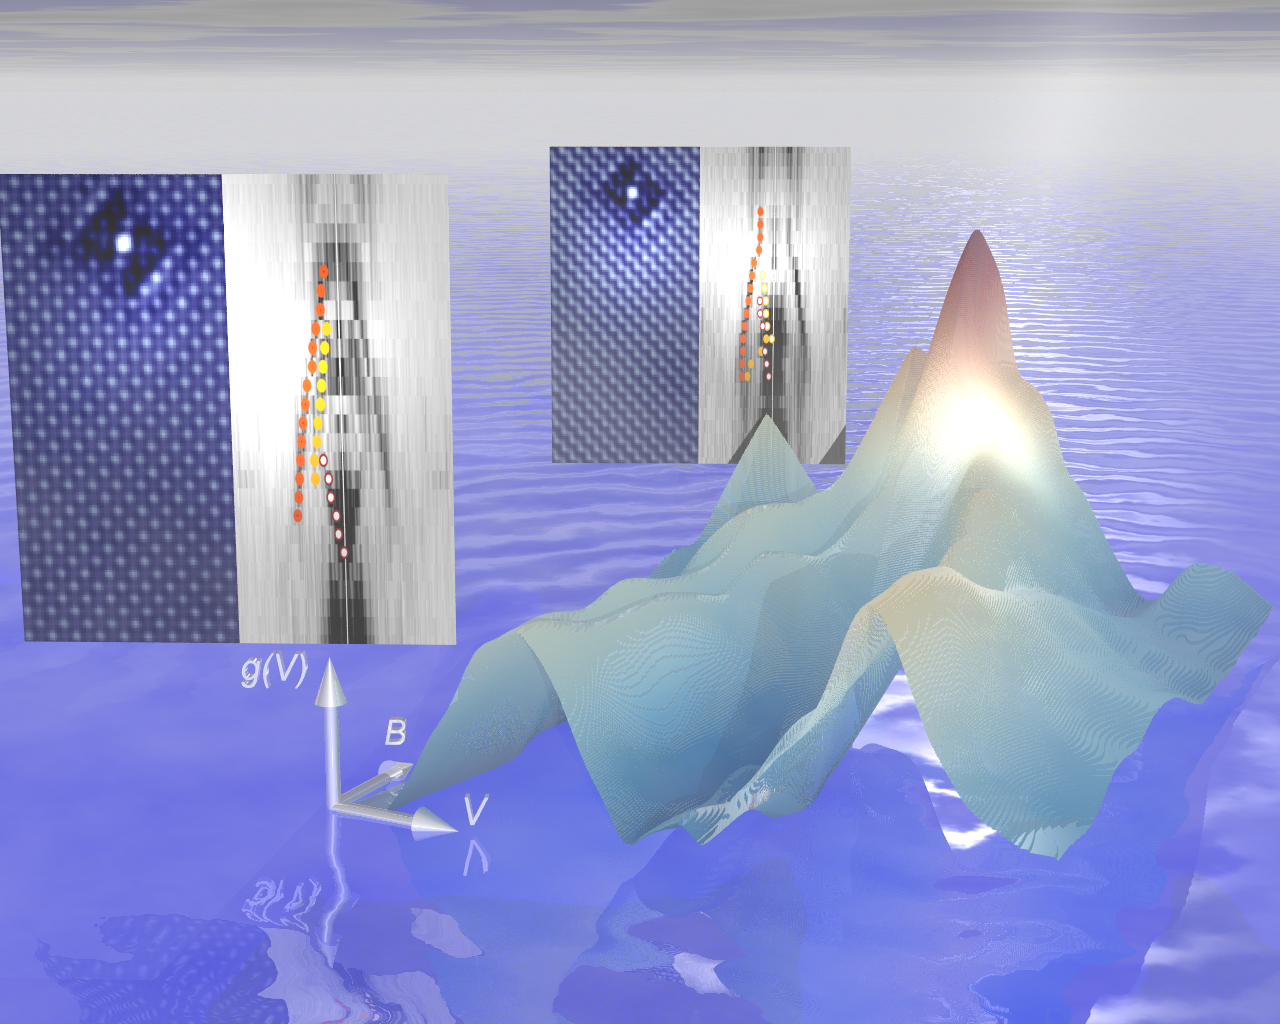
| Lifshitz transition in Sr3Ru2O7 The image is a composition of the key results: the 3D surface shows the spectroscopic evidence for a Lifshitz transition, whereas the two panels show the evidence from quasiparticle interference, as well as the field-induced stripe order that we observe. The spotlight on the 3D surface highlights where the Lifshitz transition occurs. Original publication: Carolina A. Marques, et al., Atomic-scale imaging of emergent order at a magnetic-field-induced Lifshitz transition, Sci. Adv. 8, eabo7757 (2022). |
 |
| Imaging domain walls in Fe3GeTe2 The image shows a domain wall on a hexagonal lattice, as we observe it in Fe3GeTe2 using spin-polarized STM. The water highlights that this is seen here in a metallic material. Original publication: C. Trainer, et al., Relating spin-polarized STM imaging and inelastic neutron scattering in the van-der-Waals ferromagnet Fe3GeTe2, Phys. Rev. B. 106, L081405 (2022). |
 |
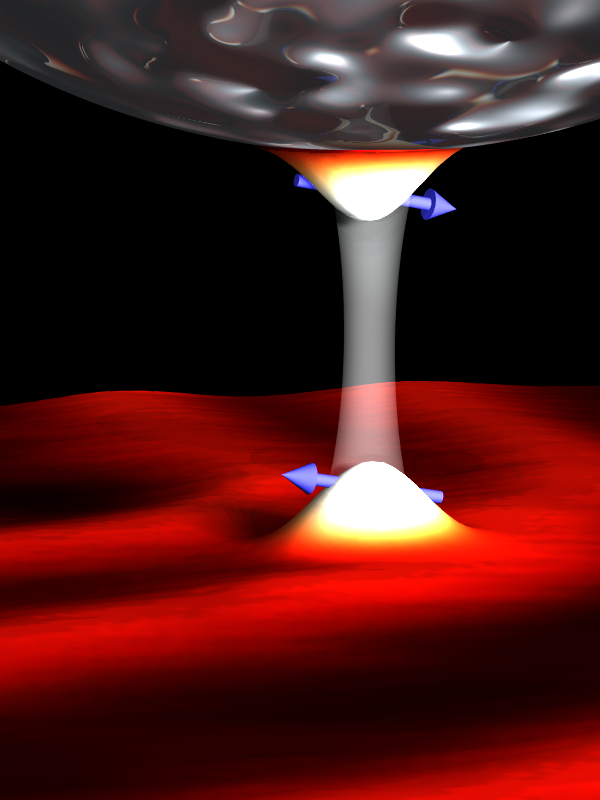
| Imaging exchange interactions with Helium. Shown is a sketch of the tip-sample geometry, with the magnetic order shown on the surface. The tunneling junction is shown as a transparent hyperboloid, with a helium atom trapped mid-way, which allows us to image the exchange interactions and, by expelling it from the junction, enables voltage control of the spin-polarisation. Original publication: C. Trainer, et al., Probing magnetic exchange interactions with Helium, Phys. Rev. Lett. 127, 166803 (2021),. |
 |
| Imaging the Van Hove singularity in Sr2RuO4. The topographic image shows the chiral quasi-particle interference observed in Sr2RuO4 due to the octahedral rotations. Original publication: A. Kreisel, et al., Quasiparticle Interference of the van-Hove singularity in Sr2RuO4, npj Quantum Materials 6, 100 (2021). |
 |
| Checkerboard charge order and nematicity in Sr2RuO4. The rendering shows a sketch of the Van Hove singularity in Sr2RuO4. The sketch is reflected from a reflective surface which has a checkerboard texture to it. The nematicity is shown through spotlights highlighting the oxygen atoms connecting ruthenium atoms in the horizontal direction, whereas the ones in the vertical direction remain dark. Original publication: Carolina A. Marques, et al., Magnetic-field tunable intertwined checkerboard charge order and nematicity in the surface layer of Sr2RuO4, Adv. Mat. 33, 2100593 (2021). |
 |
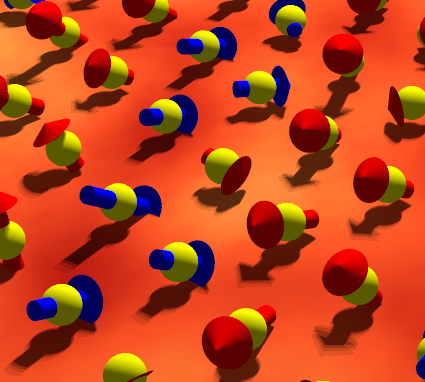
| Manipulating surface magnetic order in FeTe. Using our vector magnet STM, we have mapped out the magnetic order in FeTe, projecting the magnetisation on all three spatial directions. The image shows the magnetisation on the iron atoms reconstructed from the data, revealing an out-of-plane component of the magnetisation that does not exist in the bulk. Original publication: Christopher Trainer, et al., Manipulating surface magnetic order in iron telluride, Sci. Adv. 5, eaav3478 (2019). |
 |
| Superconductivity in non-centrosymmetric BiPd. The image blends topographic images showing the two surface terminations which correspond to the top and bottom surfaces of the non-centrosymmetric material with a sketch of the surface electronic structure and a spectrum of the superconducting gap. Original publication: Z. Sun, et al., Dirac Surface States and Nature of Superconductivity in Noncentrosymmetric BiPd, Nat. Commun. 6, 6633 (2015). |
 |
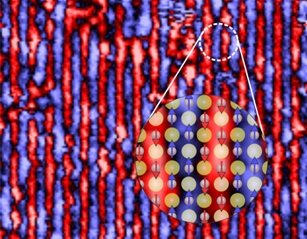
| Atomic-scale imaging of magnetism in FeTe. The image shows a spin-polarized STM image of the magnetic order in FeTe, the zoom-in shows an atomic scale model of the spins on the iron atoms. Original publication: M. Enayat, et al., Real Space Imaging of the Atomic-Scale Magnetic Structure of Fe1+yTe, Science 345, 653 (2014). |
 |
| Quantum point contact microscopy. The image shows a sketch of the tip-sample geometry when doing point-contact imaging. The surface exhibits the herringbone reconstruction of the Au(111) surface. The superimposed image shows the point contact image, which shows different atomic contrast in the different regions of the surface reconstruction. Original publication: Y. Zhang, et al., Quantum Point Contact Microscopy, Nano Letters 11, 3838 (2011). |
 |
| Single impurity Kondo physics in the weak coupling regime. The image shows the impurity density of states of a Kondo impurity in the weak coupling regime. The x-axis is the energy (or bias voltage in an STM experiment), and the y-axis the temperature. One can see the Kondo resonance disappear with increasing temperature. Original publication: Y. Zhang, et al., Temperature and Magnetic Field Dependence of a Kondo System in the Weak Coupling Regime, Nat. Commun. 4, 2110 (2013). |
 |
| A tunable two-impurity Kondo system. The image shows a sketch of the tunneling junction of a two-impurity Kondo system, where one magnetic atom is attached to the tip of the STM, while the other is on the surface. The tunnelling junction is represented by a transparent hyperboloid. Original publication: J. Bork, et al., A tunable two-impurity Kondo system in an atomic point contact, Nat. Phys. 7, 901 (2011). |
 |
| Exchange interactions between Kondo impurities. Artistic rendering of an STM measurement of cobalt atoms in different configurations on the surface. Shows is a surface with a cobalt monomer, dimer and trimer. The tip is represented as a sharp needle, which is an idealisation (i.e. STM tips are in reality not atomically sharp). Original publication: P. Wahl, et al., Determining the exchange interaction between single magnetic atoms, Phys. Rev. Lett. 98, 056601 (2007). |
 |
| Kondo effect of molecular complexes. Artistic rendering of the appearance of a cobalt tetra carbonyl molecule in an STM image. The height profile is real data. Original publication: P. Wahl, et al., Kondo Effect of Molecular Complexes at Surfaces: Ligand Control of the Local Spin Coupling, Phys. Rev. Lett. 95, 166601 (2005). |
 |